FLEXHUBS: Data-driven dynamic routing with floating connections
A study commissioned by the municipality of Rotterdam.
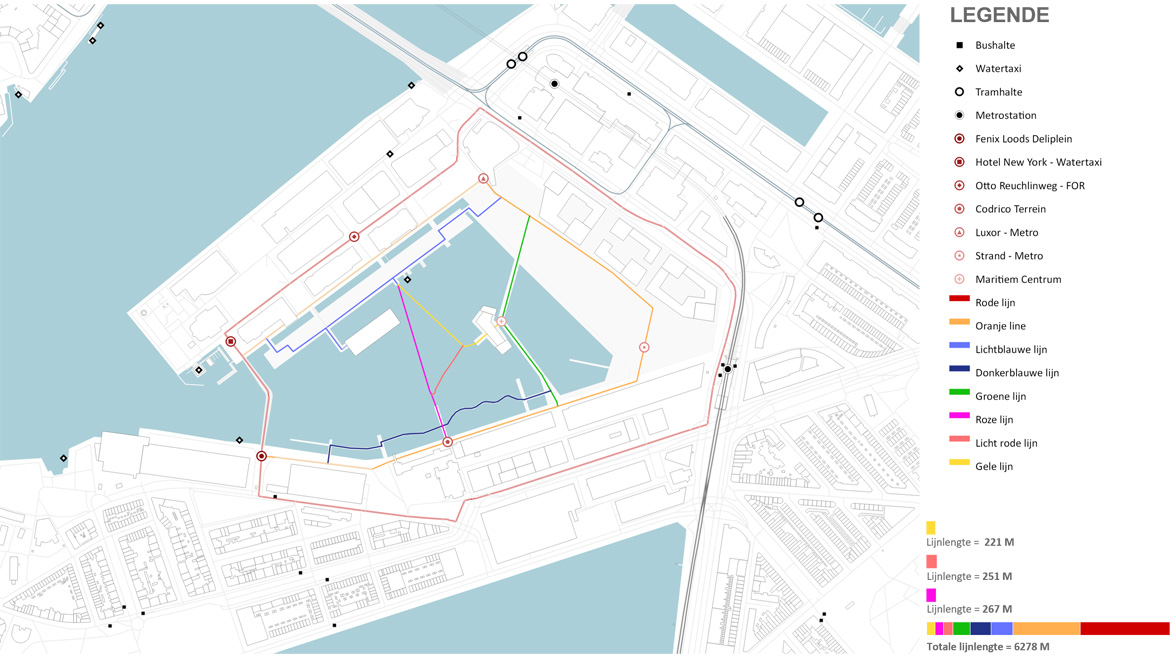
The purpose of this research is to assess the impact of dynamic floating elements on user experience in Rijnhaven, Rotterdam. A GIS-based tool links weather conditions, urban functions, public transport, and pedestrian networks to identify the most attractive areas. Three floating paths and dynamic floating elements are added to optimize pedestrian routes, with resulting performance values calculated.
The use of movable floating elements to improve public spaces is an innovative approach that has gained traction in recent years. One such space that has seen experimentation with floating structures is Rijnhaven in Rotterdam. This water body offers a unique opportunity to test the impact of dynamic floating elements on user experience and the area’s attractiveness throughout the year. A script-based tool that links GIS data and dynamic floating elements has been developed to investigate this potential.
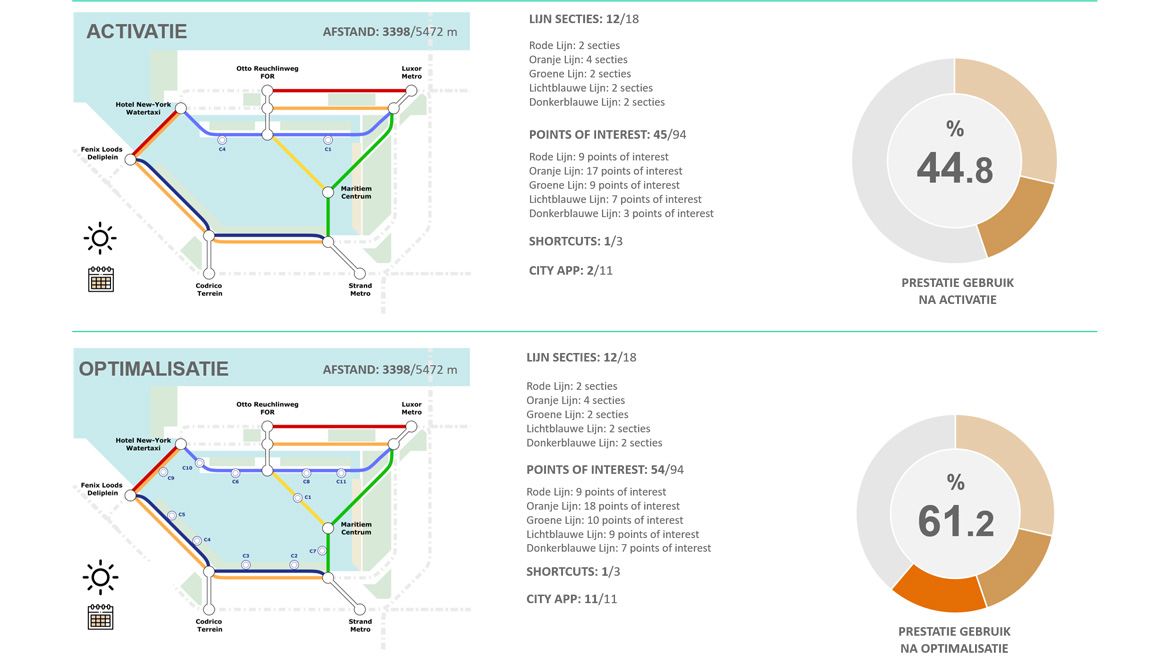
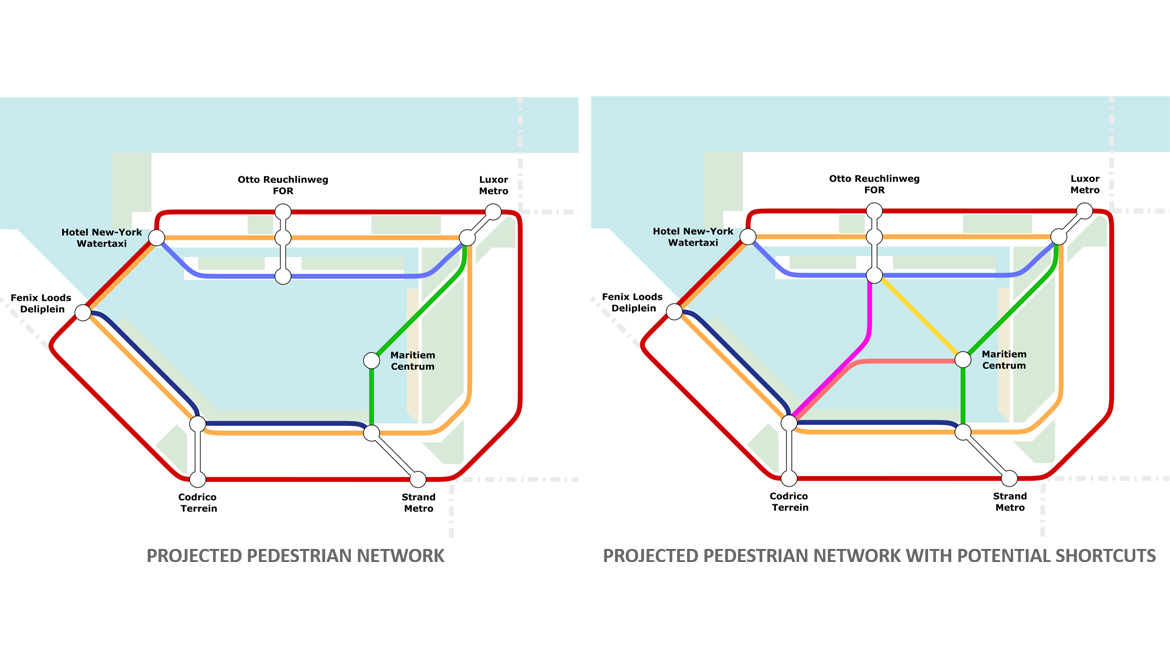
The tool considers inputs such as weather conditions, day type, urban functions, public transportation stations, and pedestrian networks to establish six scenarios. These scenarios help to attribute an attraction value to each point of interest, and the combined values within a certain radius are used to determine their respective value in each scenario. The tool then identifies the most attractive station and pedestrian lines and adds three floating paths to test if they could improve connections between these stations.
If necessary, dynamic floating elements are added along these paths to activate them. The results provide an optimized network for pedestrian travel with the minimum number of floating elements required. The tool calculates a performance value of the resulting networks and attributes values to the floating elements based on their potential function to improve the attraction of activated pedestrian lines. However, the tool’s accuracy could be improved by adding additional data such as density, daily trips, pedestrian network quality, and detailed weather conditions. On-site monitoring and experimentation would also provide further data and insights to compare to the tool’s outputs.